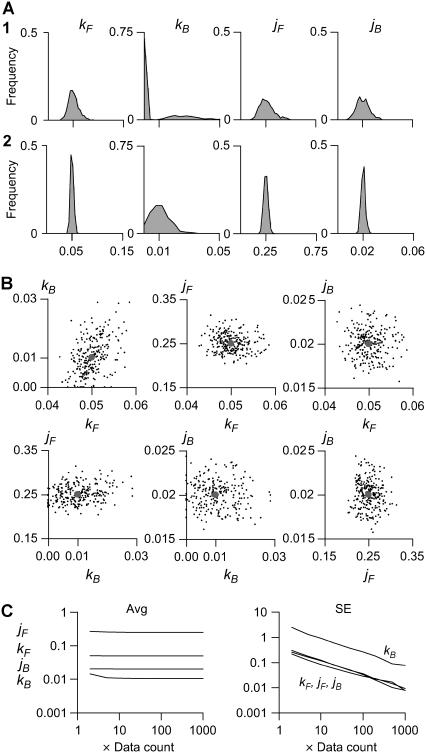
FIGURE 5.
Statistical distribution of maximum-likelihood kinetic estimates. Five-thousand dwell-sequences, each 5000 points long, sampled at dt = 0.5 s, were simulated with the model shown in Fig. 2 A and were globally fit in groups of 2…1000. (A) Rate constants are Gaussian-distributed with a width proportional to the number of data points globally fit (two traces in A1, and 20 traces in A2). The distribution of kB has much higher variance, and is bimodal when only two traces were fit (A1). This is explained by the scarcity of kB transitions: only ≈1 per segment, compared to >10 per segment for all other rates. (B) There is no apparent cross-correlation between the estimates of different parameters. The example shown is for the global fit of 20 traces. The implication is that if one parameter cannot be reliably estimated (i.e., kB), it will not lower the precision of the other estimates. The solid circles mark the correct values. (C) All four rate constants were estimated without bias, when at least 10 traces were globally fit, i.e., at least 10…100 transitions for each rate. The standard error of all but kB estimates was below 10%, when at least 10 traces were globally fit. Considering the actual number of simulated transitions, all parameters are estimated with similar precision.

