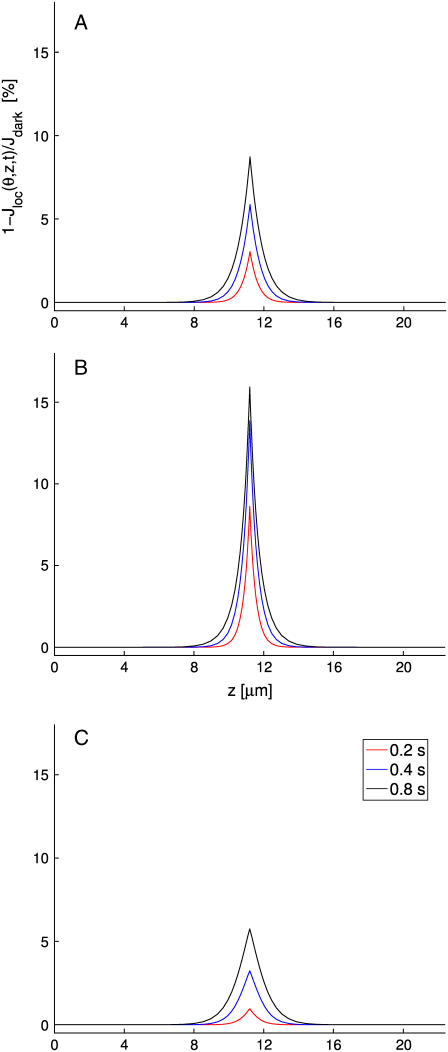
FIGURE 12.
ROS with no incisures. Shown are the z profiles of local relative response 1–Jloc(θ, z, t)/Jdark at times 0.2 s, 0.4 s, and 0.8 s. (A) Activation site is at the center of the middle disk and response is measured anywhere on the rim of the disk, since by radial symmetry, there is no θ-dependence. (B) Activation site is at distance 0.6R from the center and the response is measured at the closest point on the rim to the activation site (θ = 0). (C) Activation site is at distance 0.6R from the center and the response is measured at the farthest point on the rim from the activation site (θ = π).

