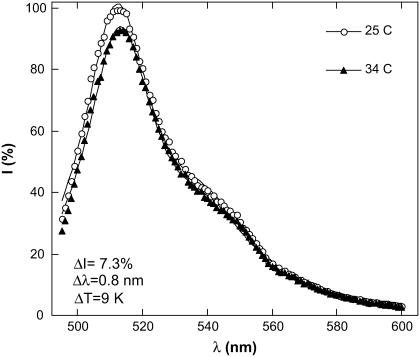
FIGURE 4.
EGFP fluorescence spectrum under 488 nm excitation at different temperatures. Solid lines show an approximation of the spectrum by two Lorentzians centered at 510 nm and at 540 nm. A temperature rise from 25°C to 34°C results in the decrease in the peak intensity, ΔI = 7.3% and in a red-shift of Δλ = 0.8 nm. The intensity of the 510 nm peak at 25°C is adopted as 100%.

