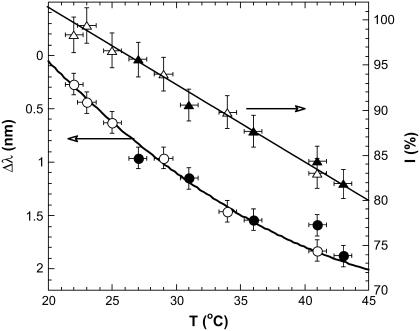
FIGURE 5.
Temperature dependence of the EGFP fluorescence. The triangles indicate I, the intensity of the strongest peak at 510 nm while the circles indicate the red-shift, Δλ. Solid symbols represent heating and open symbols represent cooling. The intensity of the 510 nm peak at 25°C is adopted as 100%.

