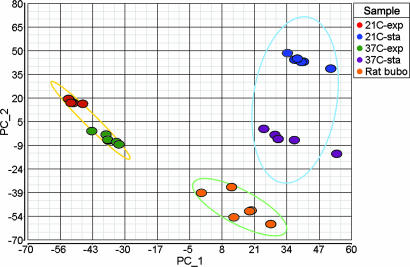
Fig. 1.
Principal component analysis of microarray data from six biological replicate samples for each of the in vitro and in vivo conditions. The first two principal components show the separation of the bubo-specific expression profile from the expression profiles in exponential and stationary-phase cultures grown at 21°C and 37°C. Ellipses encompass exponential, stationary, and rat samples.

