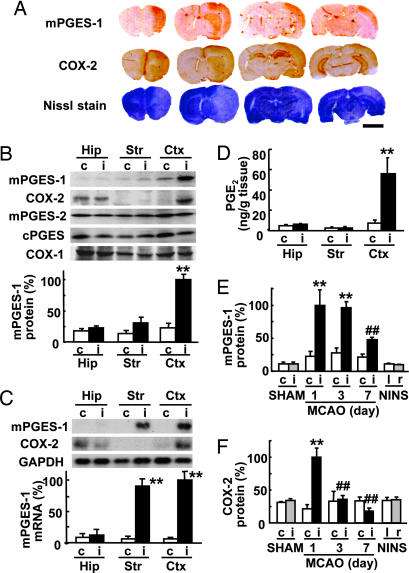
Fig. 1.
mPGES-1 induction in the rat brain after transient ischemia. (A) Immunostaining for mPGES-1 and COX-2 and Nissle staining of a coronal brain slice 24 h after ischemia. Representative data from six animals are presented. (Scale bar, 5 mm.) (B) (Upper) Western blot analysis of the expression of mPGES-1, COX-2, mPGES-2, cPGES, and COX-1 in the hippocampus (Hip), striatum (Str), and cortex (Ctx) of the ipsilateral (i) or contralateral (c) hemisphere 24 h after ischemia. (Lower) Quantitated data from immunoblotting with mPGES-1 antibody were scaled to a percentage of the maximal response. (C) (Upper) Northern blot analysis of the expression of mPGES-1 and COX-2 in the brain tissue 6 h after ischemia. GAPDH signals were used as loading controls. (Lower) Quantitated data from blotting with mPGES-1 probe were normalized to GAPDH and scaled to a percentage of the maximal response. (D) The amount of PGE2 in the brain tissue 24 h after ischemia was measured by using an enzyme immunoassay kit. (E and F) Time course of mPGES-1 (E) and COX-2 (F) protein expression in the cortex of MCAO animals, sham-operated animals killed 24 h after surgery (SHAM), and animals without surgery and ischemia (no-ischemia, no-surgery; NINS). Quantitated data from immunoblotting with mPGES-1 and COX-2 antibody were scaled to a percentage of the maximal response. n = 4 animals per group; ∗∗, P < 0.01 vs. the contralateral tissue; ##, P < 0.01; and #, P < 0.05 vs. the ipsilateral cortex (day 1).

