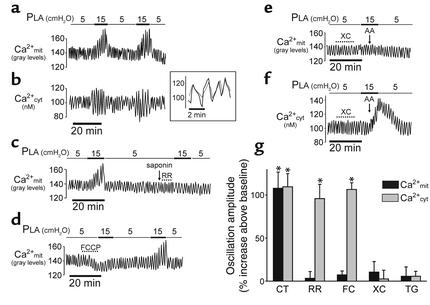
Figure 2.
Ca2+ oscillations in ECs of lung capillaries. (a–f) Traces from single capillaries show responses to PLA elevation under control conditions (a and b) and in the presence of ruthenium red (RR, 10 μM) (c), FCCP (400 nM) (d), xestospongin C (XC, 25 μM), and arachidonate (AA, 10 μM) (e and f) given as indicated. Inset in b shows determinations of rhod 2 (dotted line) and fura 2 (solid line) fluorescence obtained by alternate excitations at 550 nm and 340 nm in a single cell loaded with both dyes. Time scale is expanded to show oscillation synchronicity. Tracing in c was obtained under extracellular Ca2+-free conditions. Inhibitor was given after a 1-minute infusion of 0.005% saponin (arrow). In all traces, capillaries were infused with buffer throughout. (g) Group data show oscillation amplitudes in untreated control capillaries (CT) and in capillaries given ruthenium red (10 μM), FCCP (FC, 400 nM), xestospongin C (25 μM), and thapsigargin (TG, 2 μM). *P < 0.05. Mean ± SE, n = 3 for each bar.

