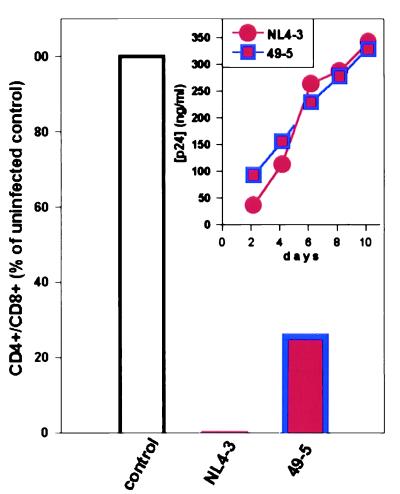
Figure 2.
CD4+ T lymphocyte depletion in PBMC cultures by paired HIV-1 strains. Shown are CD4+/CD8+ ratios in PBMC infected with NL4–3 (red bars) or 49–5 (red/blue bars) after a 10-day infection. The ratios are expressed as a percentage of that in a control (uninfected) PBMC culture. (Inset) The concentration of p24 in culture medium of PBMC infected with NL4–3 (red circles) or 49–5 (red/blue squares). These experiments are representative of three independent experiments using PBMC isolated from different donors. Color code: An individual color was assigned to each viral isolate as shown under the bar graph. The bar colors for isogenic chimeras correspond to the colors of parental viruses whereas the color of the edges correspond to the sources of Env sequences.

