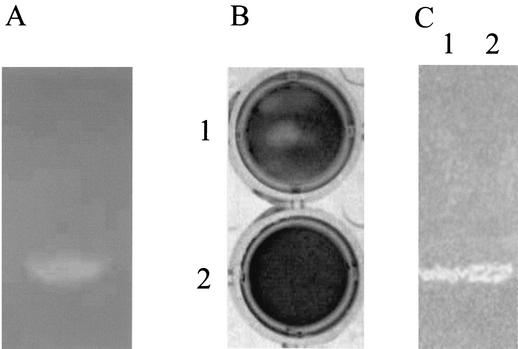
FIG. 5.
Zymogram analysis of hydrolytic activity against M. lysodeikticus cells (A) and E. coli murein sacculi (C) of recombinant protein Lys and lyso-plate assay with H. pylori sacculi (B). (A) Five micrograms of recombinant Lys protein was loaded on a 12% polyacrylamide gel containing 0.05% (wt/vol) M. lysodeikticus cells, and the gel was stained with methylene blue to visualize lytic bands. (B) Five-micrograms of recombinant Lys protein was spotted on an agar plate containing H. pylori sacculi as the substrate and incubated overnight at 37°C (plate 1). As a negative control, lysate from nontransformed Bl21 cells was spotted on another plate (plate 2). To visualize lytic zones, the gels were stained for 1 h in 0.01% methylene blue and destained with Milli-Q water. (C) Five-micrograms of recombinant Lys protein (lane 1) and 20 μg of total H. pylori proteins (lane 2) were electrophoresed in an SDS-12% polyacrylamide gel containing 0.01% (wt/vol) E. coli murein sacculi. After electrophoresis, the gel was treated to visualize lytic bands as described above.

