FIG. 4.
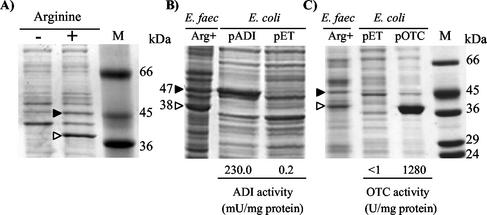
Arginine induction of the expression of arcA and arcB in E. faecalis (A) and expression in E. coli of plasmid-cloned arcA (B) and arcB (C), monitored by SDS-PAGE of cell extracts. M, protein markers. (A) E. faecalis SD10 was grown to an optical density at 600 nm of 1.4 either in the presence of 50 mM arginine (+) or with arginine replaced by 25 mM glucose (−). The induced bands of 47 and 38 kDa are indicated with a filled and an open arrowhead, respectively. In panels B and C, the left lanes show E. faecalis grown in arginine-containing medium, with indication of the 47- and 38-kDa bands corresponding to the putative arcA and arcB products. Shown in the right two lanes are IPTG-induced (1 mM, 3 h) E. coli BL21 cells transformed as indicated with either the parental pET plasmid having no insert or the pADI (B) or pOTC (C) plasmids carrying the E. faecalis arcA or arcB genes, respectively. The level of ADI or OTC activity of the sonicated E. coli extracts is given below the E. coli lanes.

