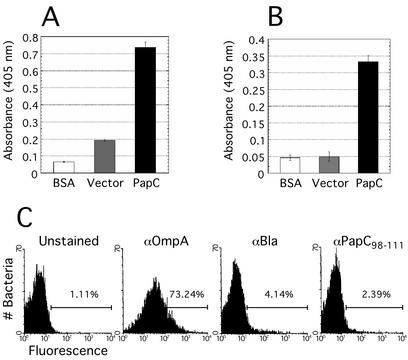
FIG. 3.
Epitope mapping of PapC. (A) ELISA performed with polyclonal anti-PapC antibody versus BSA as a background control, or whole bacteria expressing either vector alone (pMON6235Δcat) or PapC (pMJ3). Error bars, standard deviations. (B) ELISA performed with the epitope-specific antibody anti-PapC98-111 versus BSA, or OM isolated from bacteria expressing either vector alone or PapC. Error bars, standard deviations. (C) FACS analysis of whole bacteria. Bacteria were unstained (no reaction with primary antibody), or stained with either anti-OmpA (αOmpA) as a control for surface-exposed epitopes, anti-β-lactamase (αBla) as a control for periplasmic epitopes, or the anti-PapC98-111 antibody (αPapC98-111). All samples were reacted with fluorescein isothiocyanate-conjugated secondary antibodies. Each panel indicates the percent of the input bacteria with fluorescence intensities greater than the threshold indicated by the left end of the horizontal bar.

