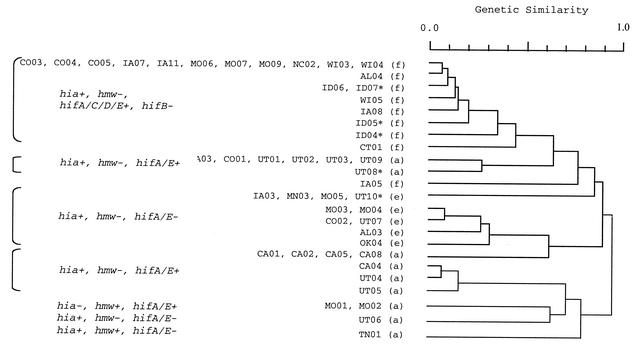
FIG. 3.
Dendrogram based on SmaI restriction digest patterns (right) of encapsulated H. influenzae isolates. Shown on the left are serotypes (in parentheses) and strain designations. To the left are hybridization results with hia, hmw, and hifA to hifE adhesin probes. +, positive; −, negative; †, COO2 was the only serotype e strain that possess the hif gene cluster; ∗, strains not included in this study. A genetic similarity of 1.0 indicates identical restriction digest patterns.

