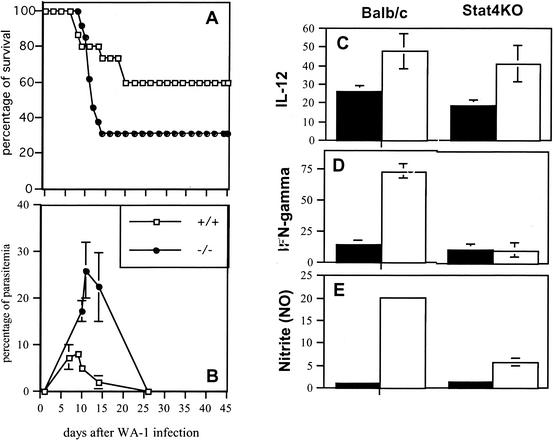
FIG. 2.
Infection course in Stat4-deficient mice. (A) Survival in Stat-4KO mice and BALB/c controls. (B) Parasitemia levels in Stat-4KO mice and BALB/c controls. (C through E) Levels of cytokines and NO in serum after infection with the WA1 Babesia. Filled bars represent uninfected controls; white bars represent infected animals. Data shown are the averages of 3 to 5 individual plasma samples. (C) Levels of IL-12 24 h after infection. (D) Levels of IFN-γ 24 h after infection. (E) Levels of nitrite in serum at day 7 after infection. Data shown are pooled from two replicate experiments.

