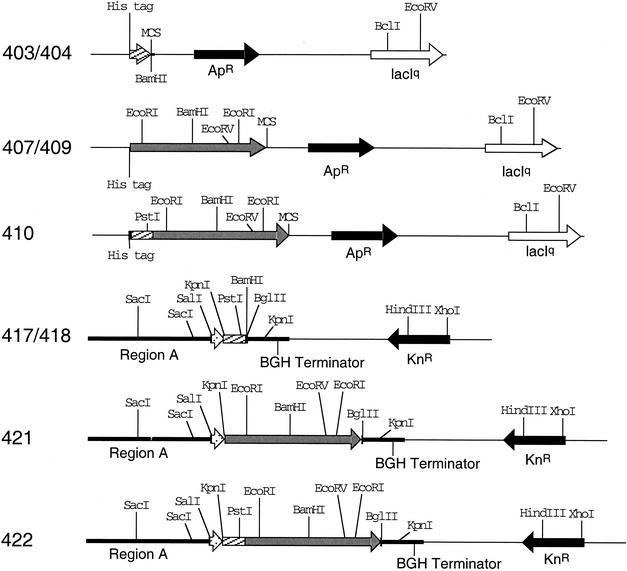
FIG. 1.
Plasmid restriction maps. Shown are the restriction site maps of plasmids constructed in this study. The plasmid numbers are shown on the left. Relevant restriction sites are also shown. The black arrows indicate antibiotic resistance markers, white arrows indicate lacIq sequences, white stipled arrows indicate tissue plasminogen activator sequences, and gray arrows indicate P71 sequences. The hatched bars indicate ESAT-6 sequences.

