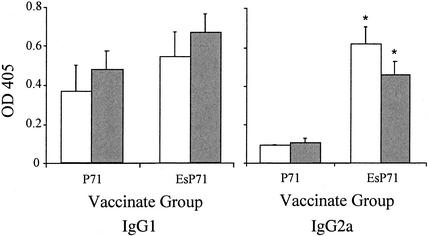
FIG. 4.
Levels of P71-specific IgG1 and IgG2a antibodies in serum from P71 and EsP71 vaccinates. Data are given as optical density at 405 nm (OD 405) and represent the means plus standard errors for two experiments that used three mice per group. White bars, day 32; gray bars, day 42. An asterisk indicates that the value was significantly different (P < 0.01) from that of the other vaccinate group for the same time point. Sera from control VR1020-vaccinated mice failed to respond to the P71 antigen (data not shown).

