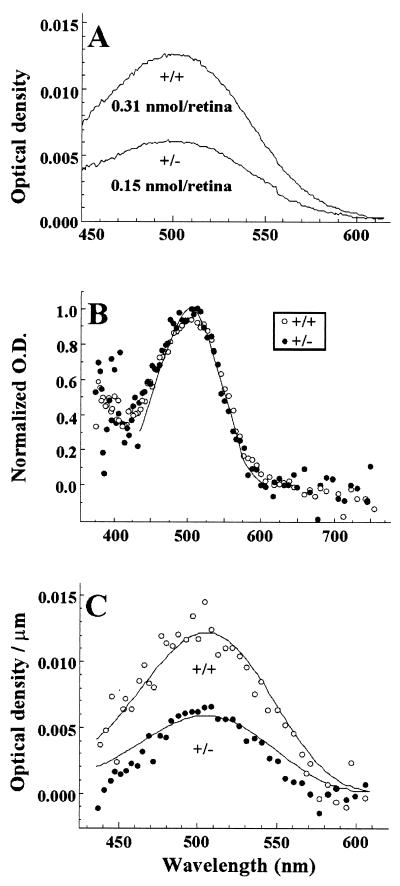
Figure 3.
(A) Difference spectra of retinal extracts. +/− retinal homogenates have approximately half the rhodopsin content of age-matched (4 week) +/+ retinas. (B) Normalized mean absorption spectra of rod masses from +/+ (open circles; n = 6) and +/− (closed circles; n = 5) mice. Fitting the template to the +/+ spectrum yielded an absorption peak (λmax) of ≈505 nm. (C) Microspectrophotometric analysis of single rods. The OD spectrum for each rod was divided by the width (in μm) of the rod’s outer segment. Circles plot the mean specific absorbance values for 30 +/+ rods (open circles) and 32 +/− rods (closed circles). The lines show the template in B, scaled to fit the +/+ and +/− results.

