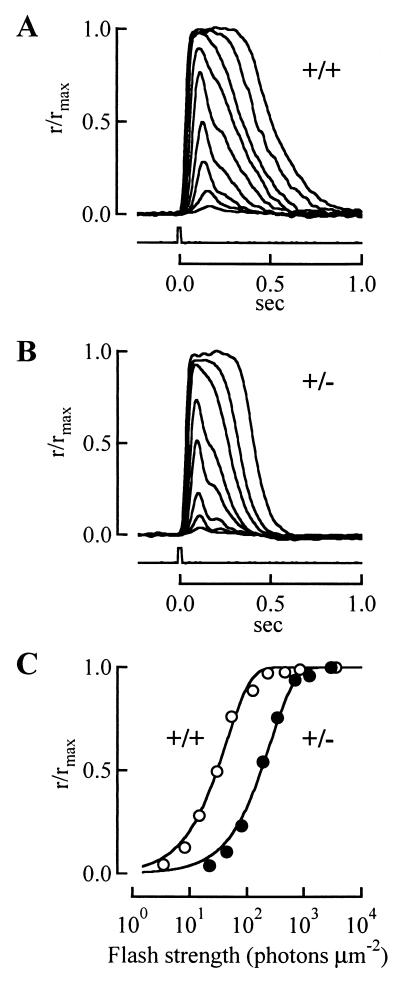
Figure 5.
Averaged responses of +/+ rods (A) and +/− rods (B) to 500-nm flashes of increasing strength. Responses are normalized to maximal response amplitudes (18 pA for the +/+ rod and 12 pA for the +/− rod). Traces underneath are signals from flash monitors. Photoresponse recovery is faster in the +/− rod. (C) Normalized response amplitudes from A and B plotted against flash strength. Lines show fit of the data to a saturating exponential: r/rmax = 1 − e−ki, where i is the flash strength, k = ln(2/i0), and i0 is the flash strength giving rise to a half-maximal response. For the +/+ rod, i0 was 30.6 photons⋅μm−2; for the +/− rod, i0 was 182 photons⋅μm−2.

