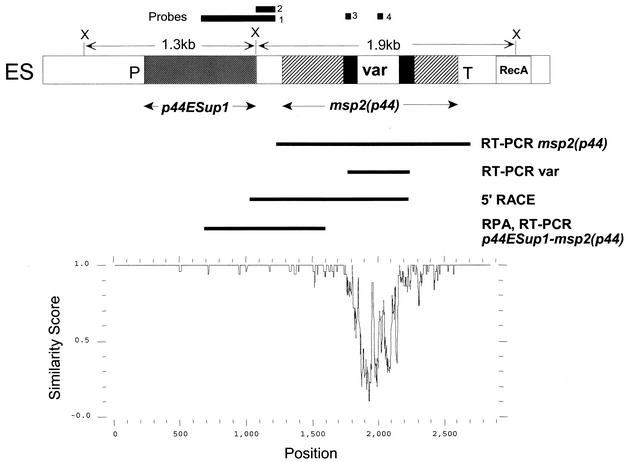
FIG. 1.
Structure and variability of a genomic expression site for msp2(p44) in A. phagocytophilum. (Top) Diagram indicating the location of msp2(p44) and an upstream gene (p44ESup1) within the expression site. Solid areas immediately flanking the variable region (var) represent sequence present in the expression site and in most genomic pseudogenes. The locations of RT-PCR and 5′-RACE products and of an RPA probe used to establish the structure of mRNA carrying msp2(p44) are indicated below the diagram. DNA probes used in Southern blots to verify locus structure are indicated above the diagram. ES, expression site; P, promoter sequence; T, terminator; RecA, a downstream sequence homologous to the recA gene; X, XbaI cleavage site. (Bottom) PLOTSIMILARITY graph, drawn to the same scale as the diagram above, demonstrating the variability of this expression locus in five different populations of A. phagocytophilum. These populations are the NY18 strain cultured in HL-60 cells, the Webster strain cultured in HL-60 cells, the HGE2 strain cultured in ISE6 tick cells (population II in Fig. 7), and two populations of A. phagocytophilum from infected human blood (patient 2, day 3, and patient 2, day 27 [Fig. 8]). A similarity score of 1.0 indicates identical sequence in a sliding window of 10 nucleotides, and a score decreasing from 1.0 to 0.0 indicates increasing variation.

