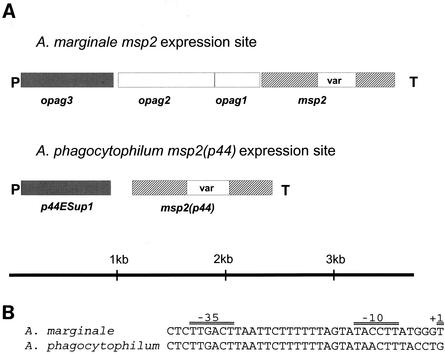
FIG. 4.
Comparison of outer membrane protein expression site structures in A. marginale and A. phagocytophilum. (A) Diagram showing the locations of expressed msp2 and msp2(p44) genes in the two organisms. Nomenclature for opag1 to opag3 of A. marginale is as in reference 27. P, predicted promoter; T, predicted prokaryotic terminator sequence; var, variable region. (B) Comparison of predicted promoter sequences in A. marginale and A. phagocytophilum expression sites.

