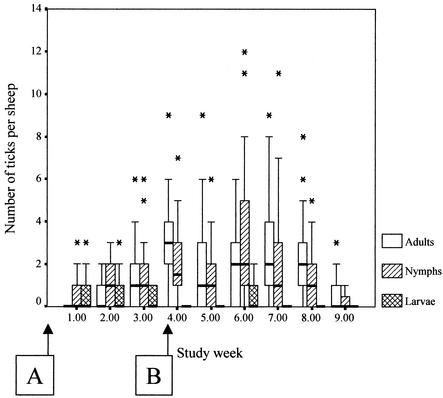
FIG. 1.
Box plots showing medians, quartiles, and outlier values of the numbers of I. ricinus ticks counted on sheep during the study. Letters in boxes refer to the groups of sheep in the study, and the arrows indicate the time points at which these groups of sheep were introduced to the I. ricinus-infested study site.

