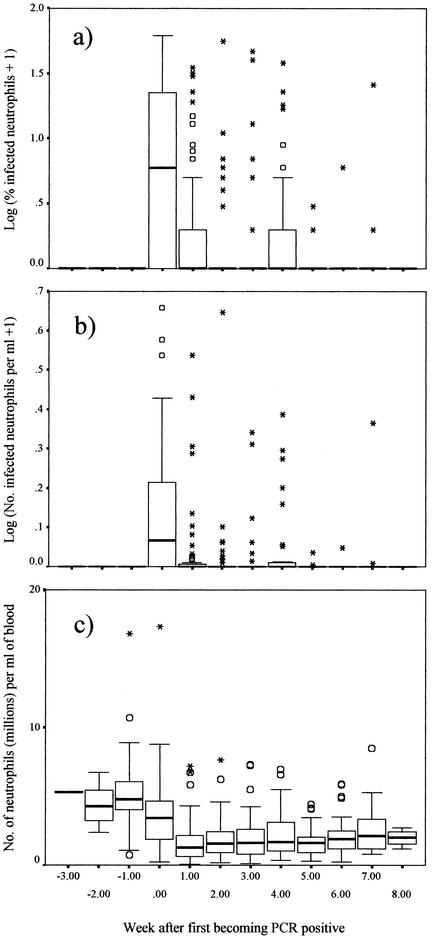
FIG. 2.
Proportion of A. phagocytophilum-infected circulatory neutrophils (log10 transformed) (A), numbers of infected cells per milliliter of blood (log10 transformed) (B), and numbers of neutrophils per milliliter of blood (C) in blood samples from the study sheep before and after the sheep acquired A. phagocytophilum infection (as detected by PCR of blood samples). Box plots show the medians, quartiles, and outlier (circles) and extreme (stars) values.

