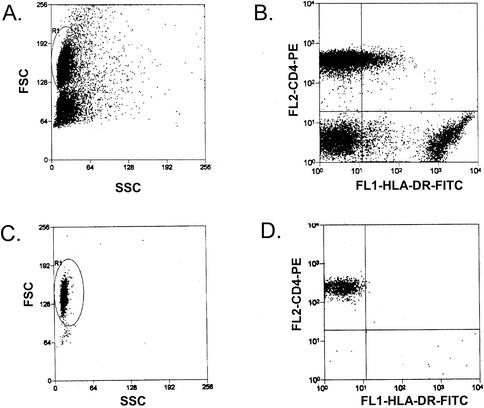
FIG. 3.
Purification of resting CD4+ T cells from infected macaques. Representative forward scatter (FSC) and side scatter (SSC) profiles (A and C) and CD4 versus HLA-DR staining (B and D) are shown before purification (A and B) and after purification by cell sorting (C and D). The purified resting CD4+-T-cell populations (CD4+/HLA-DR−) typically showed <0.5% contamination with activated cells (CD4+/HLA-DR+).

