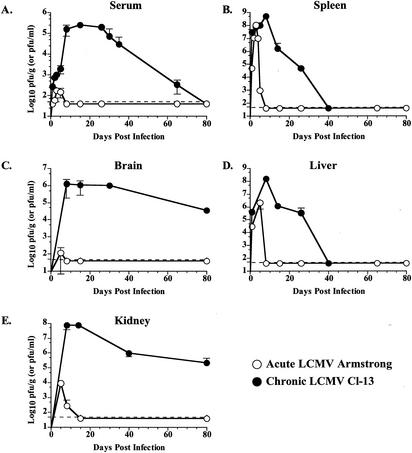
FIG. 1.
Viral kinetics during acute and chronic LCMV infection. Panels A to E show the titer of infectious virus in the indicated tissues at various times p.i. with either LCMV Armstrong (open symbols) or LCMV Cl-13 (filled symbols). (A) Titers in serum, expressed in PFU per milliliter. (B and C) Titers in the spleen, brain, liver, and kidney, respectively, expressed as PFU per gram of tissue. Data are the average for two to eight mice/time point.

