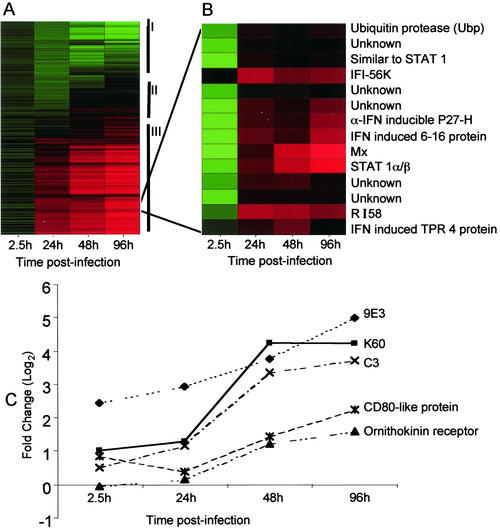
FIG. 1.
Alteration in host transcriptional program by APV infection. (A) The expression pattern of the 960 cDNAs analyzed by microarray is represented as a hierarchical cluster. Each row represents an individual cDNA element spotted on the array, and each column represents the expression states of cDNAs at a particular time point p.i. Each expression data point represents the ratio of the fluorescence intensity of the cDNA from APV-infected cells to the fluorescence intensity of the cDNA from mock-treated reference cells and is the average value of 12 data points. The cluster is subdivided into three groups indicated by roman numerals at the right, consisting of genes that were repressed (I) (green), genes that were induced (III) (red), and genes whose expression did not change (II) (black). (B) Upon principal-component analysis, all IFN-α/β-inducible genes and five unknown genes clustered together, exhibiting very similar temporal profiles. Red represents up-regulation of expression. (C) The chemokine (9E3, K60), complement (C3), and adhesion molecule (CD80-like protein, ornithokinin receptor) genes whose transcription was perturbed by APV infection also follow similar expression dynamics and cluster together.

