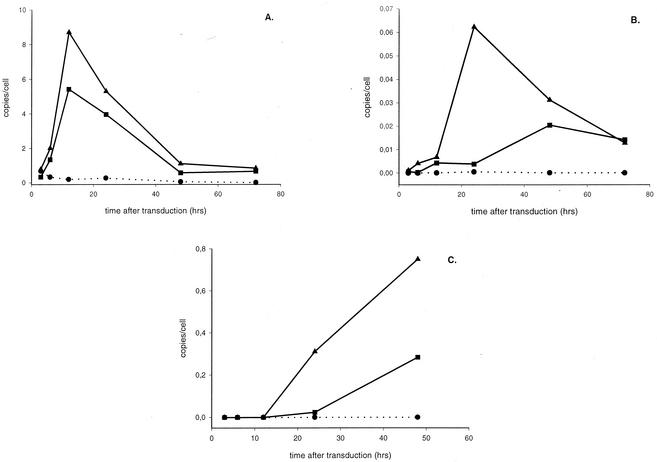
FIG. 2.
Impact of the cPPT on the amounts of different viral DNA species in transduced cells. Kinetics of the formation of total HIV-1 DNA (A), 2-LTR circles (B), and integrated proviral DNA (C) are shown. Transductions of 293T cells were carried out in parallel with HIV-1 vectors CHGFPWS and HGFPWS, respectively, with or without cPPT (MOI = 10). Quantitative real-time PCR analysis was performed on the DNA extracts of 293T cells transduced with vector without cPPT (▪) or with cPPT (▴). For each time point, an aliquot of nontransduced cells (•) (NAC) was analyzed as well.

