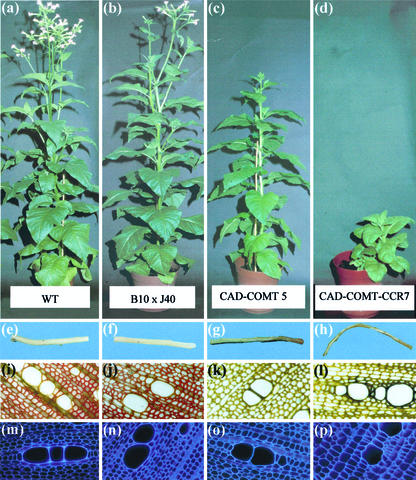
Figure 5.
Phenotypes and histochemistry of transgenics. Relative heights of plants at maturity are shown in a through d. The color of woody stem sections (with bark and cortex removed) are shown in e through h. Results of Maüle staining (i–l) and UV autofluorescence (m–p) of thin-stem sections is shown. Wild-type plants are shown in column a through m, B10 × CAD J40 are shown in column b through n, CO5 plants are shown in column c through o, and COC7 plants are shown in column d through p.

