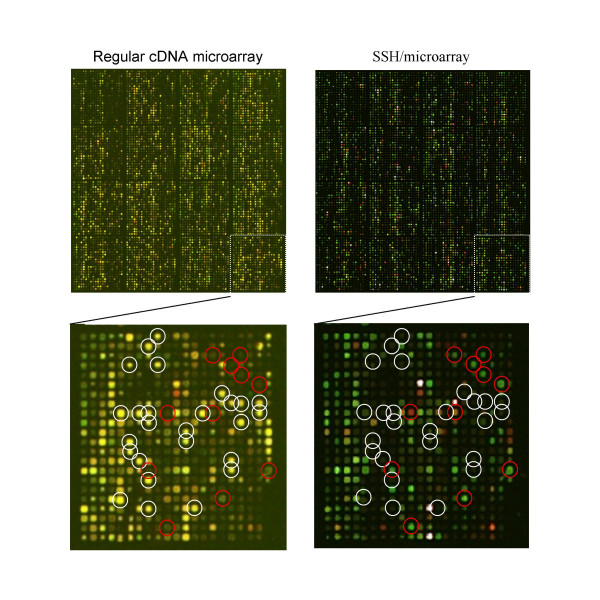
Figure 2.
The representative results of the regular cDNA microarray vs. SSH/microarray assays. RNA were prepared from the hepatoma and para-hepatoma liver tissues of a patient with HCC. Left panels are the representative results obtained via the regular cDNA microarray assays using the Cy 5 and Cy3 labeled aRNA generated from hepatoma and non-hepatoma liver tissues, respectively. Right panels are the representative results obtained via the SSH/microarray assays using Cy3 and Cy5 to label the forward and reverse subtracted amplicons, respectively. Lower panels are the close views of the upper panels. White circles indicate the clones, which had equal Cy3 and Cy5 hybridization intensities in the conventional cDNA microarray assays but been subtracted away from the subtracted amplicons. Red circles mark the clones, which had low Cy5 and Cy3 hybridization intensities in the conventional cDNA microarray but presented with differential expression in the subtracted amplicons.

