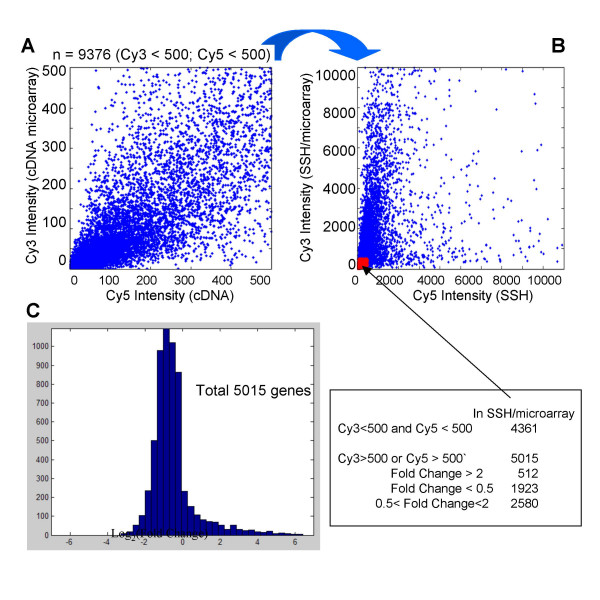
Figure 3.
Detection of differential low-expression transcriptomes by the SSH/microarray. A) Of the 14811 distinct genes on the chips, 9376 genes had hybridization intensities lower than 500 units (the defined low intensity threshold for exclusion from further microarray analysis) in a representative set of results of the conventional cDNA microarray assay. B)These low-expression genes were then subjected to re-calibration for their Cy3/Cy5 intensities in the SSH/microarray assay and 5015 genes became detectable in SSH assays (blue spots). C) The distribution of these 5015 low-expression genes identified only in the SSH/microarray assays, including 512 and 1923 genes down- and up-regulated in hepatoma tissues, respectively. The data presented in this figure were based on the results derived from patient 1, a case of chronic hepatitis C with cirrhosis and hepatoma.

