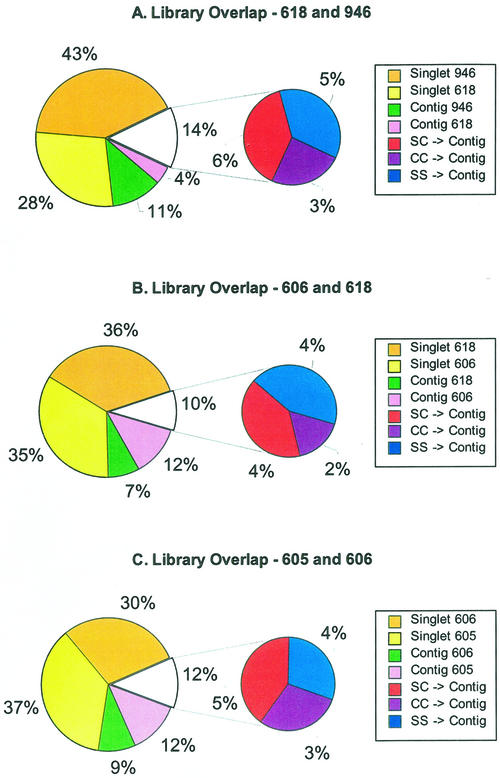
Figure 1.
Comparison of TUG overlap between three pairs of cDNA libraries. The first section (starting at the top and moving counterclockwise) of the larger pie chart in each panel represents the singlets unique to the second library. The second section represents the singlets unique to the first library. The third and fourth sections represent the contigs unique to the second and first libraries, respectively. The smaller pie charts in each panel represent the TUGs containing ESTs from both libraries. The three sections of each smaller pie chart represent TUGs with one EST from both libraries (“SS → C”), one EST from one library, and multiple ESTs from the second library (“SC → C”), and multiple ESTs from both libraries (“CC → C”). In A, 1-mm tassel primordia (library 946) is compared with 0.5- to 2.0-cm tassels encompassing stages of organ specification and early differentiation (library 618). In B, library 618 is compared with 1- to 2-cm immature ear (library 606) containing similar stages of organ differentiation. In C, library 606 is compared with developing endosperm 10 to 14 d postpollination (library 605).

