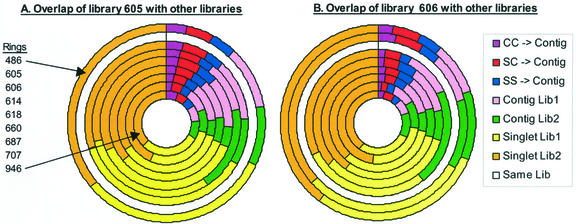
Figure 2.
Multiple pair-wise comparisons of TUG overlap between one EST library and each of the eight other EST libraries listed in Table I. A, Comparison of the endosperm library (605) with the other libraries with each ring representing a comparison between library 605 and one other library. The order of the library comparisons is listed in the figure, starting with the outermost ring (library 486). B, Comparison of the immature ear library (606) with the other libraries. The first three sections of each ring (starting at the top and moving clockwise) correspond in color and meaning to the sections of the smaller pie charts in Figure 1. As in Figure 1, these three sections represent TUG overlap between the two libraries. The next four sections correspond in color and meaning to the sections of the larger pie charts in Figure 1.

