
Fig. 3.
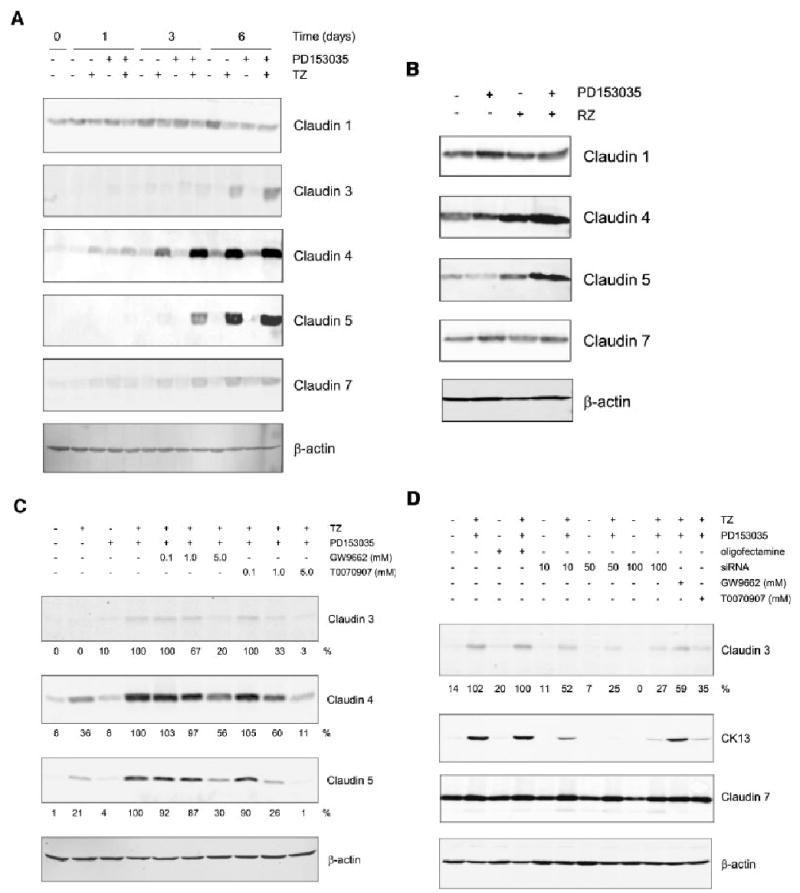
Effect of PPARγ ligands (TZ and RZ) and PD153035 on claudin protein expression in NHU cells. NHU cell were treated for 24 h with 1 μM TZ (A) or RZ (B), in the presence or absence of PD153035 (1 μM) and protein was extracted at 0, 1, 3 and 6 days for cells treated with TZ (A) and at 6 days for cell treated with RZ (B). Media were replaced every 3 days with fresh PD153035 added. Cell extracts (20 μg) were resolved on 12.5% SDS–polyacrylamide gels and transferred onto nitrocellulose membranes. Membranes were incubated with pre-titrated primary antibodies for 16 h at 4°C, as indicated. Bound antibody was detected with fluorescent-conjugated secondary antibodies and quantified using an infrared imaging system (LI-COR Odyssey). β-actin was used as an internal loading control. Similar results were obtained in three (TZ) and two (RZ) independent NHU cell lines. C: NHU cells were pretreated for 3 h with or without the PPARγ antagonists GW9662 or T0070907 (0.1, 1.0, 5.0 μM) and PD153035 (1 μM) as indicated. Next, cells were treated in the presence or absence of TZ (1 μM) for 24 h, followed by treatment with or without PD153035 (1 μM) for 6 days, all in the presence of PPARγ antagonists (as indicated). After 6 days, protein was extracted and 20 μg was separated per lane on a 12.5% SDS–polyacrylamide gel, transferred onto a nitrocellulose membrane and incubated 16 h at 4°C in the presence of the primary antibody, as indicated, and visualised as above. D: NHU cells were treated with or without TZ (1 μM) for 24 h in the presence of PPARγ siRNA (10, 50 or 100 nM) or GW9662 (5 μM) or T0070907 (5 μM) as indicated. Next, media were replaced with or without PD153035 and GW9662 or T0070907 as indicated and again on day 3. After, 6 days protein was extracted and separated on SDS–PAGE as outlined in (C).