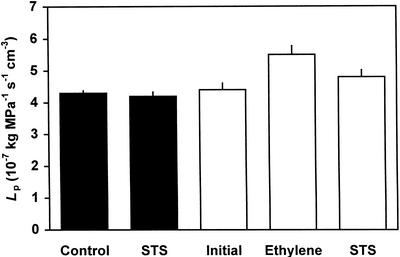
Figure 2.
Effects of STS on ethylene-enhanced Lp of aspen seedlings. Each data point represents mean (n = 7) ± se. The black bars indicate the control group and the white bars indicate the ethylene-treated group. The same root system of each group was measured after application of ethylene and/or STS.

