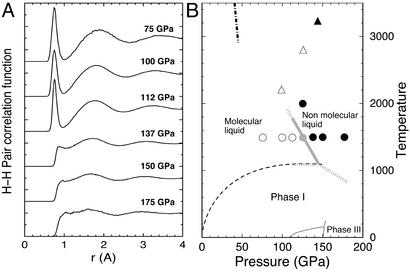
Figure 2.
(A) Pair correlation functions of hydrogen at 1,500 K and the pressures indicated. (B) Sketch of the hydrogen phase diagram. Circles indicate points where simulations were performed; ○ correspond to points where the system was found to be molecular (nonmolecular points are indicated by ●). Triangles indicate shock-wave points from ref. 2. A continuous transition from insulating (▵) to metal (▴) behavior was observed. The dashed line is an extrapolation of the melting line (7). The dash-dotted line is an extrapolation of the first-order transition line predicted by quantum Monte Carlo simulations with free-particle nodes for the electronic wave function (24). Gray lines indicate suggested phase boundaries.

