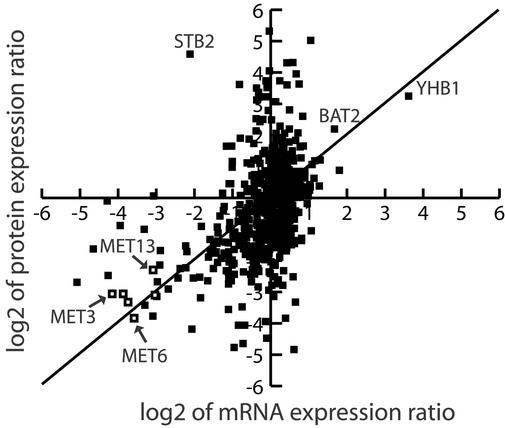
Figure 2.
Scatter plot representation of the correlation between mRNA and protein expression ratios. The log2 value of the mRNA and protein ratios of expression in YEPD media vs. 15N minimal media for each locus was calculated and plotted for the 678 loci for which positive oligonucleotide array intensities and protein expression ratios were determined. A solid line is shown to represent the perfect positive correlation line. In addition, the open boxes shown indicate a grouping of each data point from loci in the methionine biosynthetic pathway from Table 3. The names of additional selected loci are also shown.

