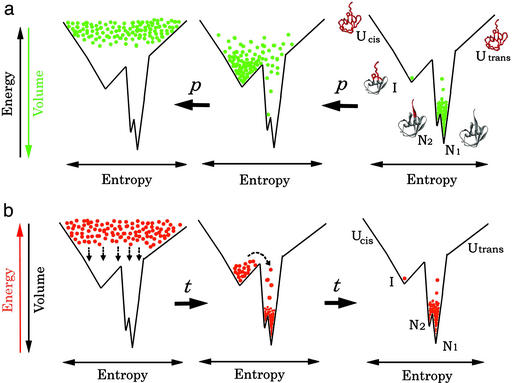
Figure 5.
The concept of the equilibrium pressure experiment (a) vs. the concept of the kinetic folding experiment (b), carried out under closely identical solution conditions. The vertical axis of the funnel represents the internal energy of a hydrated protein molecule (increasing upwards), i.e., a free energy of a single protein molecule, parallel to the conformational order of a polypeptide chain (increasing downwards). The horizontal scale represents conformational entropy. The density of dots at each position in the funnel represents either the equilibrium population of the protein molecule under pressure or a transiently occupying population at a certain time after commencement of the folding experiment. Protein structures are drawn with WebLab VIEWERLITE 3.2, with the red color representing highly disordered segments.

