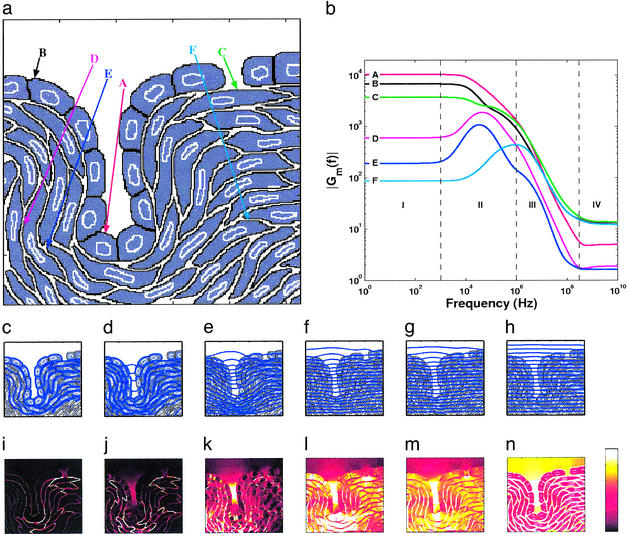
Figure 4.
Didactic multicellular system model. (a) Electrolyte-filled cavity and endothelial layer with cells connected by tight junctions, with an invagination and a gap in the cell layer. The upper region is saline (extracellular electrolyte). The underlying region contains subendothelial cells with ≈15% extracellular fluid. (b) Gm(f) from 10 Hz to 10 GHz at cell membrane sites A–F. (c–h) Equipotentials for 100 Hz, 100 kHz, 1 MHz, 10 MHz, 100 MHz, and 1 GHz, respectively. (i–n) SAR distributions (spatially averaged value of 1 W⋅kg−1; color bar: black = 0 to white ≥2 W⋅kg−1) for the same frequencies. SAR is proportional to ρJ2 and is displayed instead of J⃗ because SAR is more closely related to local heating and possible thermal effects.

