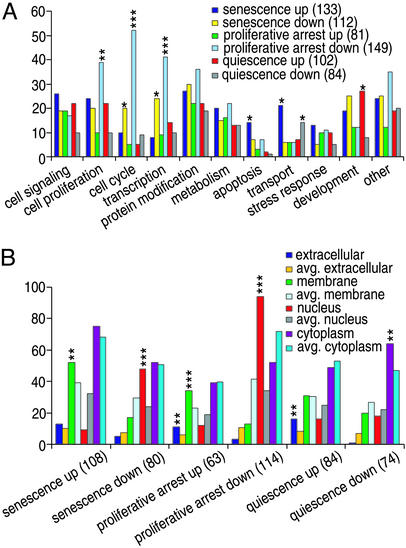
Figure 1.
Genes showing altered transcription in human fibroblasts during senescence or quiescence. Biological processes (A) and cellular locations (B) associated with products of genes bearing gene ontology annotations are shown. The number of genes in each group is given in parentheses. The likelihood of enrichment of genes in a group due to random events (P value) is indicated by asterisks: *, P < 0.05; **, P < 0.01; ***, P < 0.001.

