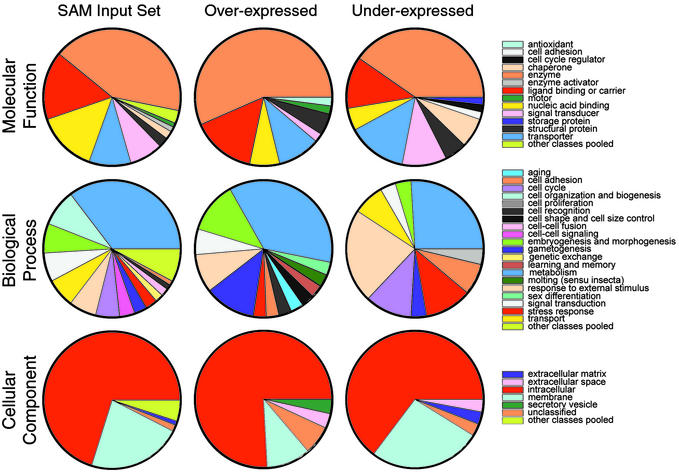
Figure 3.
Classification of regulated genes (up- and down-) according to GO (MF, level 1; CC, level 2; and BP, level 2) and comparison with the genes used for the study (SAM input set). To assess the statistical significance of differences between sets of genes, we have calculated pairwise Chi2. Chi2 P values are given in the following order for each of the classes: SAM input vs. whole fly, overexpressed vs. SAM input and underexpressed vs. SAM input. The P values are as follows: MF1, 0.820, 0.008, and 0.006; BP2, 0.845, 0.000, and 0.000; and CC2, 0.931, 0.002, and 0.384.

