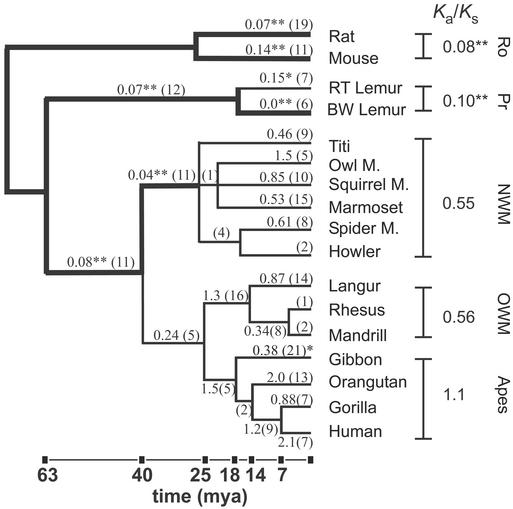
Figure 3.
Rates of synonymous and nonsynonomous substitutions in the TRPC2 gene across primate phylogeny. Pairwise comparisons of sequence from all species were performed and Ka/Ks values were computed. Within-group values show the average Ka/Ks ratio for all pairwise comparisons in a group. A double asterisk indicates that Ka/Ks is not compatible with neutral evolution (P ≤ 0.002). The Ka/Ks values computed by using predicted ancestral sequences are shown above the corresponding branch of the tree, and the total number of substitutions is shown in parentheses. Branches on which selective pressure was strongly evident (P ≤ 0.002) are shown with a thick line, and Ka/Ks values are marked with a double asterisk. This P value was derived by using the Bonferroni correction to ensure an overall type I error rate (false rejection of the null hypothesis) of 5% for each of the 22 tests conducted. On two branches, Ka/Ks values were significantly different from unity at P < 0.05. These branches are marked with a single asterisk. Lengths of branches are proportional to divergence dates for lineages of NW monkeys and OW monkeys and apes. Dates are based on ref. 34. Ro, rodent; Pr, prosimian; mya, million years ago.

