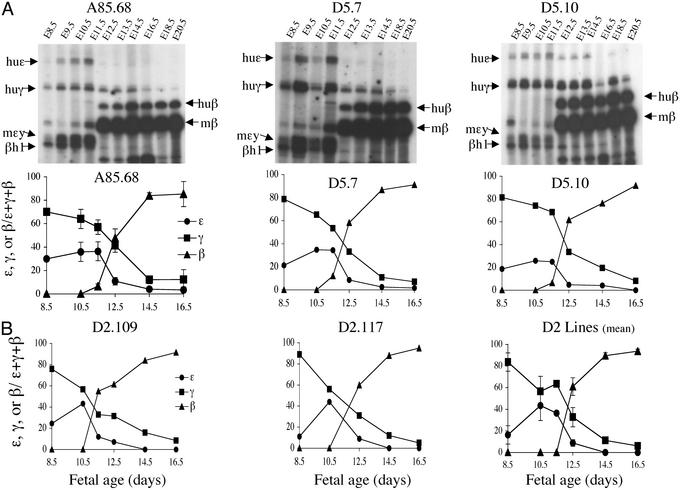
Figure 4.
Primer extension analyses of the D2- and D5-deleted transgenic lines. (A Upper) Autoradiographs of primer extension products resolved on acrylamide gels. The transgenic line from which tissues were harvested is indicated above each gel. The developmental time point of tissue harvest is indicated above each lane. Specific extension products are indicated by arrows and labeled to the right and left of each autoradiograph. Graphic representations of the PhosphorImager analysis are shown below the autoradiograph. (B) Graphic representation of developmental expression of D2.109 and D.117 are shown individually and the mean expression of multiple experiments from both transgenic lines is also shown.

