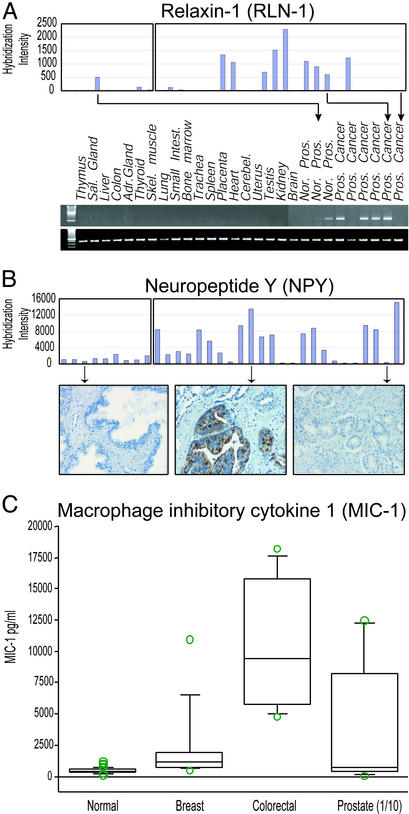
Figure 3.
Validation of microarray gene expression by RT-PCR, IHC, and ELISA. (A) RNAs from multiple different human tissues. Three normal and six primary prostate carcinomas were reverse-transcribed and amplified under standard conditions by using primers directed toward relaxin-1 (4). (Upper) The primary microarray data are shown (hybridization intensity on the y axis; samples on the x axis). (Lower) A representative PCR is shown. Primers specific for 18S were used to control for the amount of amplified cDNA. (B) IHC was performed with an anti-NPY antibody on whole tissue sections. (Upper) Primary microarray data are shown. (Lower) Examples of IHC staining in normal, microarray-positive, and microarray-negative prostate cancers. (C) Box plot showing MIC-1 serum levels in normal subjects (n = 260) and patients with breast (n = 10), colon (n = 8), and prostate (n = 9) carcinoma. P values were determined by comparison with normal by ANOVA. The prostate serum MIC-1 levels were divided by 10 (1/10) for graphical representation.

