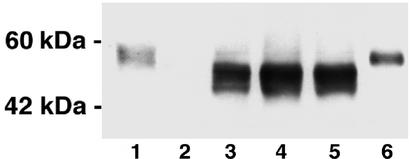
Figure 1.
Western blot analysis of α-gal A expression in the liver of wild-type and α-gal A knockout mice. Lane 1, liver lysates from wild-type mice; lane 2, noninjected α-gal A knockout mice; lanes 3–5, liver lysates from three separate α-gal A knockout mice i.v.-injected with rAAV-CAG-hAGA vector; lane 6, human α-gal A.

