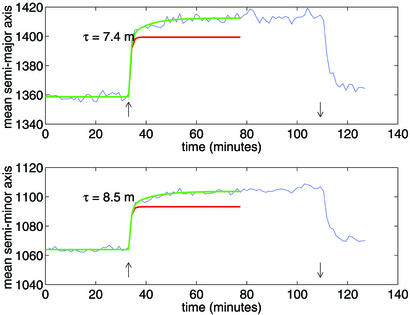
Figure 5.
An ensemble-averaged, low time-resolution history of the semimajor (Upper) and semiminor (Lower) spore axes for the first run. The up- and down-pointing arrows indicate the times of switching from dry to humid and from humid to dry conditions, respectively. The red line shows the prediction of the time history (until t = 80 min) from the short-time scale swelling fit using the high time-resolution data; the green line shows the fit when an additional slow component is included, as in Eq. 2.

