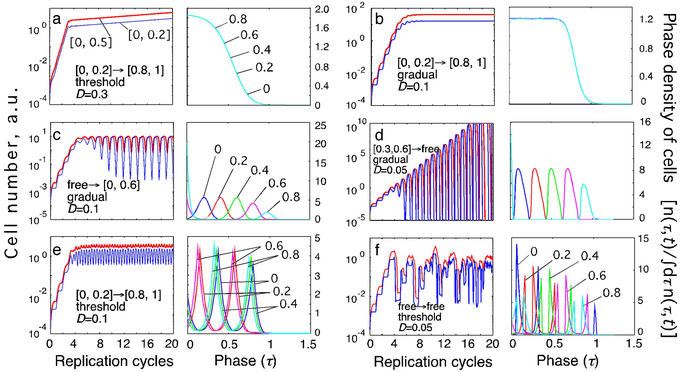
Figure 2.
Examples of different types of kinetics of an infected cell population in a primary infection. Initially, cells are assumed to be distributed uniformly over the parasite replication cycle phase. (Left) The dependence of the infected cell numbers in the interval [0, 0.5] (thick red lines) and in the interval [0, 0.2] (thin blue lines; Mathematical Formalism, Eq. 11) on time (in units of Δ). (Right) The phase density of infected cells vs. the phase of replication cycle, τ, at five equally spaced times within the 10th cycle of infection (shown at curves in units of Δ). The phase density at each time is normalized, so that its total integral is equal to 1. (Left) Model parameters for different cases: inducing interval [τ , τ
, τ ] → target interval [τ
 , τ
, τ ], the type of immune response (threshold or gradual), and D (Table 1 and Fig. 1a). (a) Unlimited expansion of infected cells. (b) Steady state in the absence of oscillations. (c) Steady state with periodic oscillations caused by parasite synchronization (period close to Δ, tertian). (d) Unlimited expansion with oscillations. (e) Oscillations with half-period (close to Δ/2, quotidian). (f) Chaotic oscillations.

