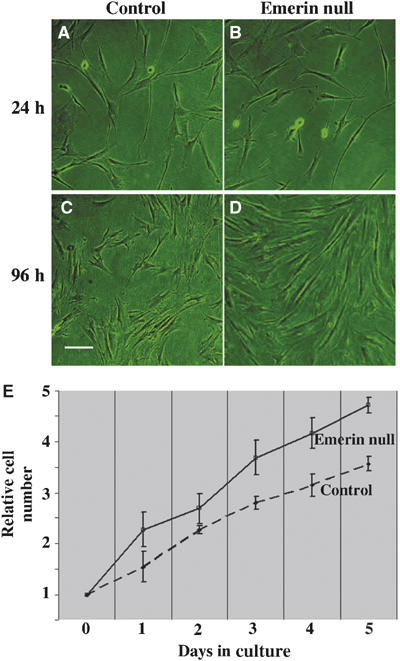
Figure 4.

Emerin null fibroblasts display a rapid growth phenotype. wt (A, C) or emerin null fibroblasts (B, D) were grown in culture and photographed 24 h (A, B) and 96 h (C, D) after subculture. Alternatively, cells were harvested and counted each day. (E) Shows relative cell numbers after subculture for wt (control) and emerin null fibroblasts over 5 days. Each time point represents pooled data from three different wt and three different emerin null fibroblast strains. At each time point, the relative number for emerin null fibroblasts was always statistically greater than for wt fibroblasts. The P-values were as follows: day 1, 0.03; day 2, 0.05; day 3, 0.001; day 4, 0.005; and day 5, 0.002.
