
Figure 2.
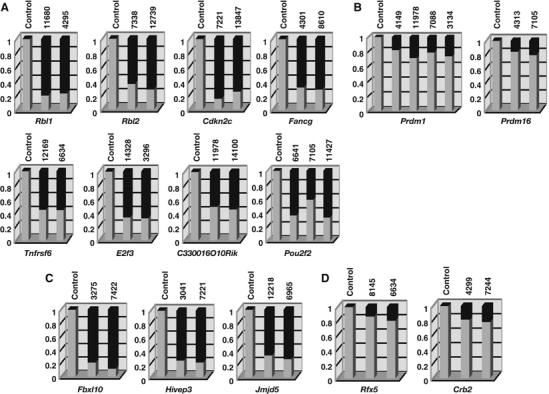
Quantitative analysis of retroviral integrations in tumor DNAs of AKXD-Blmm3 mice. Southern blots of genomic tumor DNAs were performed using flanking probes for each CIS gene. Tumor ID numbers are shown at the top of each column. A tumor that does not have a viral integration at that locus was used for the control. Gel images were acquired using a luminescent image analyzer and the band intensities quantified using the Image Gauge ver.4 software. The ratio of the intensity of the wild-type band (light gray) and mutant band (dark gray) is shown for each tumor sample. Among the CIS genes whose coding regions were consistently disrupted by viral integration, some of the genes (A) showed evidence of bi-allelic integration, but others (B) did not. (C) Bi-allelic integrations were also detected for three other CIS genes whose expressions were downregulated by viral integration, (D) but was not detected in CIS genes whose expressions may be upregulated by viral integration in AKXD-Blm+/+ lymphomas.