
Figure 3.
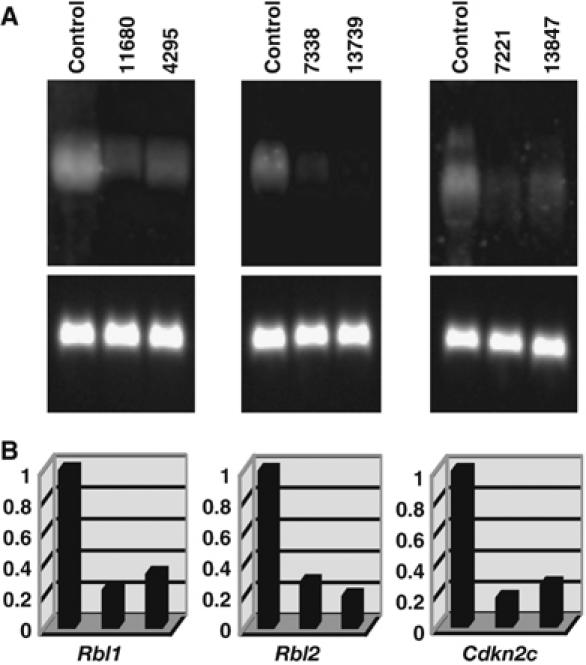
Expression analysis of candidate TS genes in AKXD-Blmm3/m3 lymphomas. (A) Northern blots. Total RNAs from the indicated tumors were fractionated on 1.0% agarose–formaldehyde gels and transferred onto nylon membranes. Tumor ID numbers are shown at the top of each gel. A similar type of tumor that does not have a viral integration at that locus was used as a control. Probes for each candidate TS gene were labeled with digoxigenin and used for hybridization. The blot was treated with anti-DIG antibody conjugated with alkaline phosphatase and then developed with CDP-Star reagents. The same blot was stripped and rehybridized with a glyceraldehyde phosphate dehydrogenase (GAPDH) probe (lower panel) to control for RNA loading. (B) Quantitative analysis of the Northern blots. Gel images were acquired using a luminescent image analyzer and the intensities of the bands quantified. Arbitrary units were shown on vertical axis regarding the expression level of control cells as 1.