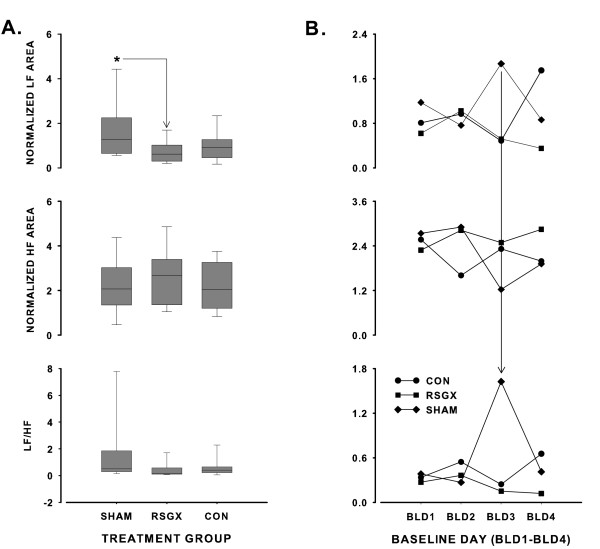
Figure 3.
Panel A depicts vertical Box and Whisker plots of normalized low frequency (LF) power, normalized high frequency (HF) power, and resultant LF/HF ratios for the right stellate ganglionectomy group (RSGX), sham (SHAM) operated control group, and the time control (CON) group. Each box contains a horizontal line indicating the median value of the treatment group, the lower and upper boundaries of each box represent the 25th and 75th percentile values, and the lower and upper whiskers (resembling error bars) depict the 5th and 95th percentiles. The asterisk in the top graph indicates that LF power of SHAM animals differed significantly from that of RSGX animals. Panel B shows LF power (top), HF power (middle), and LF/HF ratio (bottom) on each baseline day (BLD1–BLD4) for each treatment group. The vertical solid line extending from top graph to bottom graph points to the marked increase in LF/HF ratio on BLD3 for the SHAM group.

