Figure 5.

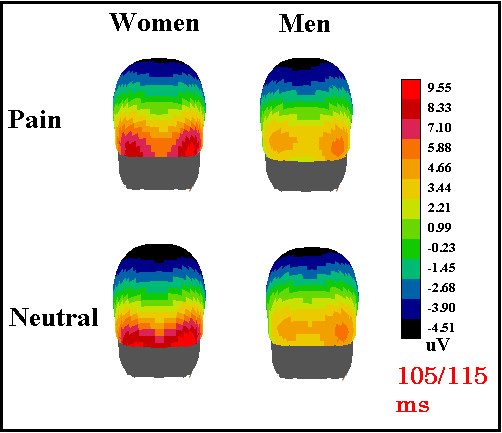
Back view of the scalp distribution of surface potentials recorded in the latency range of P110 according to subject gender and type of facial expression.

Back view of the scalp distribution of surface potentials recorded in the latency range of P110 according to subject gender and type of facial expression.