
Figure 5.
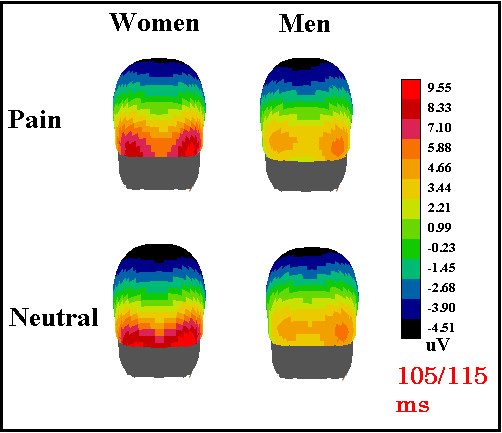
Back view of the scalp distribution of surface potentials recorded in the latency range of P110 according to subject gender and type of facial expression.
Official websites use .gov
A
.gov website belongs to an official
government organization in the United States.
Secure .gov websites use HTTPS
A lock (
) or https:// means you've safely
connected to the .gov website. Share sensitive
information only on official, secure websites.
Back view of the scalp distribution of surface potentials recorded in the latency range of P110 according to subject gender and type of facial expression.